Video games
Over the next five years, video games will grow at a CAGR of 6.5% to reach US$86.9bn in 2017, up from US$63.4bn in 2012.
Video games is one of the few E&M segments in which Japan is set to stay ahead of China until the end of the forecast period. With a CAGR of 7%, Japan’s video gaming market will be worth US$13.7bn in 2017. Double-digit growth will emerge from a variety of markets, with the most dynamic surges coming from Nigeria (22% CAGR), Kenya (20% CAGR), India (18% CAGR), and Vietnam (15% CAGR). Once again, Russia is Europe’s standout performer, as it is set to become the world’s eighth-largest video gaming market in 2017. The only other European markets to show any signs of above-average growth are Czech Republic, Hungary and Poland.
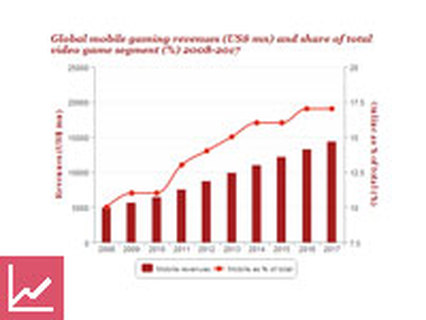
Global mobile gaming revenues (US$ mn) and share of total video game segment (%) 2008-2017
Mobile will be the fastest-growing video games sector over the next five years, with revenues increasing from US$8.8bn in 2012 to US$14.4bn in 2017 by a CAGR of 10% as an increasing number of consumers turn to smartphones for entertainment.
Over the next five years, video games will grow at a CAGR of 6.5% to reach US$86.9bn in 2017, up from US$63.4bn in 2012.
Video games is one of the few E&M segments in which Japan is set to stay ahead of China until the end of the forecast period. With a CAGR of 7%, Japan’s video gaming market will be worth US$13.7bn in 2017. Double-digit growth will emerge from a variety of markets, with the most dynamic surges coming from Nigeria (22% CAGR), Kenya (20% CAGR), India (18% CAGR), and Vietnam (15% CAGR). Once again, Russia is Europe’s standout performer, as it is set to become the world’s eighth-largest video gaming market in 2017. The only other European markets to show any signs of above-average growth are Czech Republic, Hungary and Poland.
Global mobile gaming revenues (US$ mn) and share of total video game segment (%) 2008-2017
Mobile will be the fastest-growing video games sector over the next five years, with revenues increasing from US$8.8bn in 2012 to US$14.4bn in 2017 by a CAGR of 10% as an increasing number of consumers turn to smartphones for entertainment.
Consumer spend on console games will increase by a CAGR of 5% from US$24.9bn in 2012 to US$31.2bn in 2017 as Sony’s PlayStation 4 and Microsoft’s rumoured new Xbox console reignite interest in console gaming. That growth will lead to North America overtaking Western Europe to regain in 2014 its number one position in console sales.
Console revenues by region (US$ mn) 2011-2017
In many entertainment and media segments, China will overtake Japan in terms of size by 2017; in some cases, it has already. This is not the case in video gaming, however, because Japan will retain its position as the world’s second-largest market, at US$13.7bn in 2017, behind the US at US$18.2bn but ahead of China at US$11.4bn.
Total video game revenues for the top 3 markets (US$ mn) 2008-2017
Although PC revenues remain stagnant, consumers are not abandoning the platform. With online revenues set to reach US$30bn in 2017, consumers are merely shifting from pay to own to pay to play.
Global end user spending split by type (US$ mn) 2008-2017
Online spending will increase by an average of 8% per year over the next five years. By 2017, the online platform will have almost reached parity with consoles; and US$97 will be spent on online games for every US$100 spent on console games.
Global online gaming revenues (US$ mn) and share of total video game segment (%) 2008-2017
How we define this segment
This segment breaks down advertising via video games and consumer spending on video games by component, including console, online, PC and mobile. It excludes spending on the hardware used to play the games. Revenues from console and PC are split by physical and digital.
The Console category covers all revenues from playing games of any type on a games console (both in home and handheld). It includes game sales at retail, digital game sales, additional downloadable content (DLC) and subscription services.
PC games covers revenues from traditional, more complex PC games sales. The category includes sales revenues from retail and digital-download stores (Steam and Origin) and additional downloadable content.
Mobile gaming considers all revenues from playing games on a mobile device (tablet or mobile phone). It includes digital games sales, subscription services and associated virtual items.
Online gaming includes games played on a PC that require an Internet connection. It covers subscription MMOs, free-to-play MMOs, casual games and social games.
Video games advertising covers all revenues generated from advertising on any games platform and access type, including in-game and console-dashboard advertising.
What data is included in the online Outlook?
Forecasts for consumer and advertising spend in the video games segment across 50 countries cover (where available):
· Console physical spending (US$ m)
· Console digital spending (US$ m)
· Total console spending (US$ m) (total = physical + digital)
· PC physical spending (US$ m)
· PC digital spending (US$ m)
· Total PC spending (US$ m) (total = physical + digital)
· Online gaming spending (US$ m)
· Mobile gaming spending (US$ m)
· Video game advertising (US$ m)
· Total end user spending (US$ m) (total = console total + PC total + online + mobile)
· Total video game spending (US$ m) (total = total
